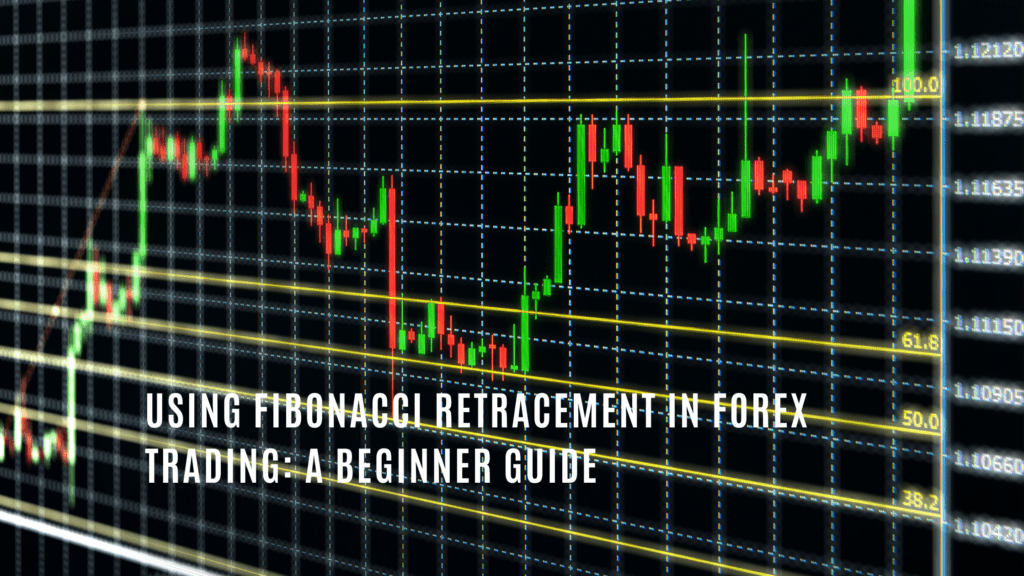
Forex Traders can use Fibonacci retracement as a technical analysis tool to identify potential levels of support and resistance in the Forex market. By plotting horizontal lines at the Fibonacci levels of 23.6%, 38.2%, 50%, 61.8%, and 100%, traders can identify potential levels where the price may reverse or continue its trend. In this article, we will discuss how to use Fibonacci retracement in Forex trading using a practical example with the EUR/USD currency pair.
How to Use Fibonacci Retracement in Forex Trading
To use Fibonacci retracement, a trader must first identify the high and low points of the price action for a currency pair. These points will serve as the starting and ending points for the Fibonacci retracement levels. In the case of the EUR/USD currency pair, let us say that the high point was at 1.2000, and the low point was at 1.1000.
The trader can then plot the Fibonacci retracement levels on the price chart using the high and low points as the starting and ending points. The 23.6% level will be at 1.1176, the 38.2% level will be at 1.1138, the 50% level will be at 1.1100, the 61.8% level will be at 1.1062, and the 100% level will be at 1.1000.
Identifying Support and Resistance
Once the Fibonacci retracement levels have been plotted, a trader can use them to identify potential support and resistance levels. For example, if the price of the EUR/USD currency pair is trending upward and reaches the 38.2% level, it may encounter resistance and potentially reverse its trend. On the other hand, if the price trends downwards and reaches the 61.8% level, it may encounter support and potentially reverse its trend.
It is important to note that the Fibonacci retracement levels are not exact, and traders should use them with other technical indicators and analysis to confirm potential support and resistance levels. In addition to identifying possible levels of support and resistance, traders can use Fibonacci retracement with other technical indicators to confirm trends and possible entry and exit points. For example, traders may use the Fibonacci retracement levels in conjunction with trend lines or moving averages to confirm the strength of a trend.
Another essential aspect to consider when using Fibonacci retracement is the time frame of the chart. The levels may be more significant on a higher time frame chart, such as a daily or weekly chart, compared to a shorter time frame chart, such as a 5-minute or 15-minute chart. It is also important to note that the levels may change as the market conditions change, so traders should continuously monitor the levels and adjust their trading strategy accordingly.
Traders should also be aware of the limitations of Fibonacci retracement and understand that it is just one tool among many that can be used in technical analysis. It should not be used in isolation, and traders should always consider the broader market conditions and use a combination of technical and fundamental analysis to make informed trading decisions.