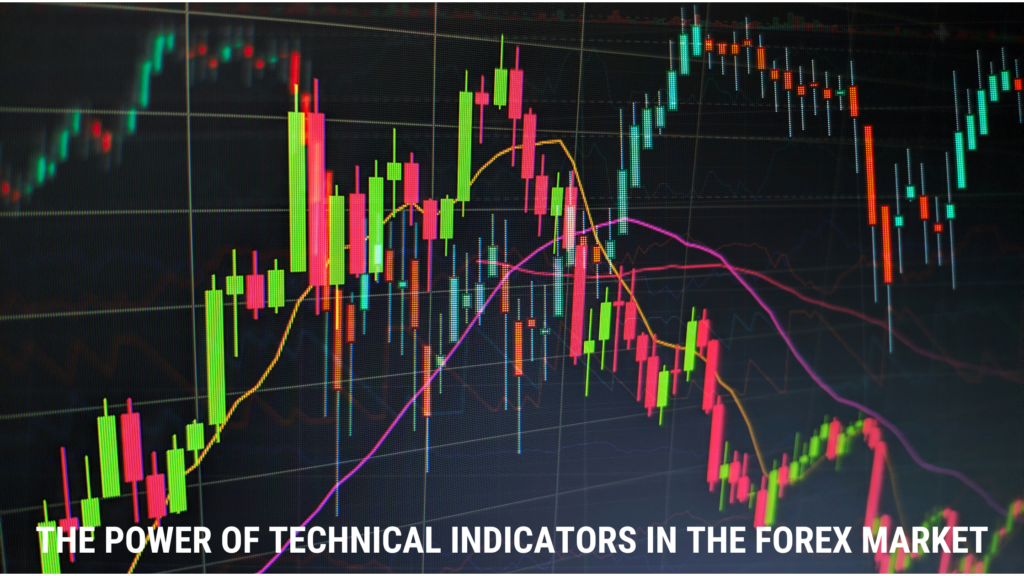
The foreign exchange market, or forex, receives recognition for its volatility and fast-paced nature. To navigate this dynamic market, traders often rely on technical analysis and technical indicators.
Mathematical calculations serve as the basis for technical indicators derived from the historical and current price action of a currency pair, creating both lagging and leading outputs, a factor traders need to consider in their analysis. Traders will use technical indicators to generate buy and sell signals, find trends, and identify potential support and resistance levels.
Introduction to Technical Indicators:
Over time, technical indicators continue to serve as useful tools for forex traders looking to make informed decisions in the market. As previously mentioned, these indicators use mathematical calculations based on historical and current price action, which traders can use to find patterns and trends that can support buying or selling opportunities.
The trading world comes with various technical indicators available to traders, each with its strengths and weaknesses. Popular technical indicators used in the forex market include but not limited to:
- The Relative Strength Index (RSI):
As a momentum indicator, the RSI compares the magnitude of recent gains to the magnitude of recent losses for a currency pair or any traded financial instrument. Traders can use the RSI to identify overbought or oversold conditions, and traders can use this information to decide when to enter or exit a trade.
- The Moving Average Convergence Divergence (MACD):
As a trend-following indicator, the MACD calculates the difference between two moving averages to indicate a trend. The MACD indicator can help traders identify potential buy and sell signals and determine when to enter or exit a trade.
- Fibonacci Retracement:
As a technical indicator, the Fibonacci Retracement uses a sequence of numbers and a golden ratio to plot horizontal lines that display mathematically derived support and resistance areas. Traders use the Fibonacci Retracement on the belief that financial markets will retrace a predictable portion of a move, after which they will continue to move in the original direction.
- Ichimoku Cloud:
As a technical indicator, traders use the Ichimoku Cloud to identify support and resistance levels and to spot buy and sell signals. The Ichimoku Cloud uses five lines as part of the indicator structure. The Cloud represents the current trading range, and the upper and lower boundaries represent potential resistance and support levels.
Using Technical Indicators in a Trading Strategy:
While technical indicators can provide valuable information, traders should use them with other analysis methods, such as fundamental analysis and market sentiment. Traders should also incorporate risk management and position sizing in their strategies. Additionally, traders should consider conducting back testing on indicators and strategies using historical data before live trading.
In conclusion, technical indicators can serve as powerful tools for forex traders looking to make informed decisions in the market. By understanding and using popular indicators such as the RSI, MACD, Fibonacci retracement, and Ichimoku Cloud, traders can identify potential buying and selling opportunities and make trades that align with market trends.
However, traders should remember that technical indicators only represent one aspect of an overall strategy and would serve themselves well considering other factors, such as economic and political factors and trading psychology.

