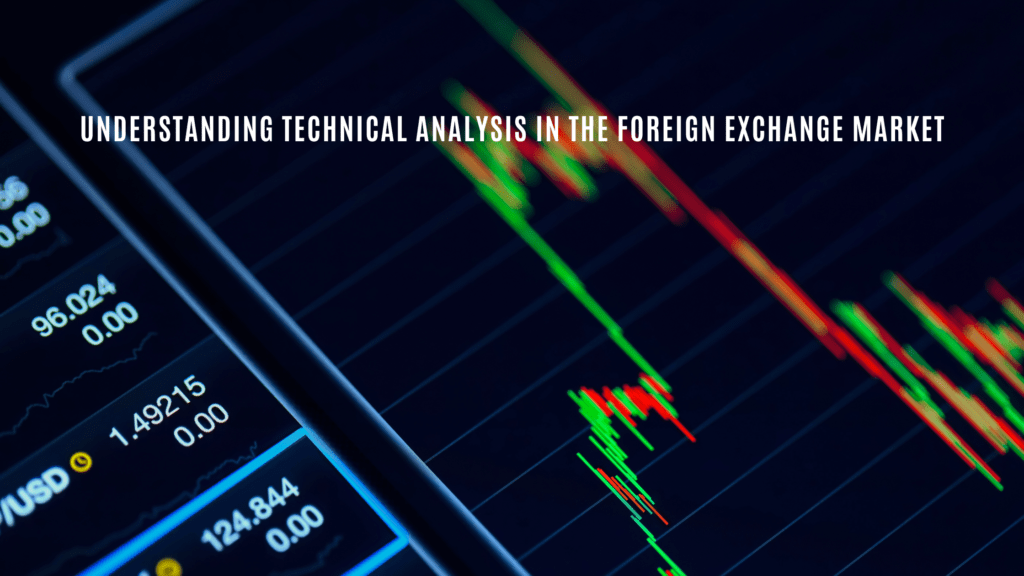
The foreign exchange market, forex, is one of the largest and most liquid markets in the world. Every day, billions of dollars get traded as individuals, businesses, and financial institutions buy and sell currencies. Technical analysis is a tool traders use to make decisions in the forex market.
Technical Analysis in the Forex Market
Technical analysis aims to understand market behavior by looking at historical data and identifying patterns that traders can use in an attempt to predict future activity. It is based on the idea that market trends, as shown by charts and other technical indicators, will continue in the future.
Trading Charts
Charts are a vital component of technical analysis, providing traders with a visual representation of price and volume data. By studying charts, traders can identify patterns and trends indicating buying or selling opportunities. One of the most popular forms of technical analysis in the forex market is the use of charts.
The most used chart types include line charts, bar charts, and candlestick charts.
- Line charts are the simplest type of trading chart created by connecting data points with a line. These charts can show the overall direction of a currency pair over a specific period.
- Bar charts contain similarities to line charts but include information about the high and low prices for a currency pair during a specific period. These charts can often show volatility and help traders identify potential support and resistance levels.
- Candlestick charts are a more advanced type of chart that provides more information than line and bar charts. These charts display the opening and closing prices and the high and low prices for a currency pair over a specific period.
Trading Indicators
Another important aspect of technical analysis in the forex market is the use of technical indicators. Technical indicators derive their output from mathematical calculations based on the price of a currency pair. They are used to generate buy and sell signals and identify trends and potential support and resistance levels. Some indicators are trend-following, while others are momentum-based. Here are some indicators commonly used in the forex market:
- The Relative Strength Index (RSI) serves as a momentum indicator designed to measure the magnitude of recent gains in a financial instrument, such as a currency pair, to the magnitude of its recent losses. This indicator can identify overbought or oversold conditions and help traders decide when to enter or exit a trade.
- The Moving Average Convergence Divergence (MACD) indicator serves as a trend-following indicator that uses the difference between two moving averages to indicate a trend. This indicator can identify potential buy and sell signals and help traders decide when to enter or exit a trade.
- The Fibonacci retracement serves as a technical indicator using horizontal lines derived from a mathematical sequence to indicate support and resistance areas.
Conclusion
Technical analysis plays a vital role in the foreign exchange market by providing traders with the tools needed to make informed decisions. By understanding and using charts and technical indicators, traders can potentially identify opportunities for buying and selling and make trades that align with market trends.
However, it is essential to note that technical analysis should be just one aspect of a trader’s overall strategy. Economic and political factors can also play a significant role in the forex market, and traders should consider them in their decision-making process.

