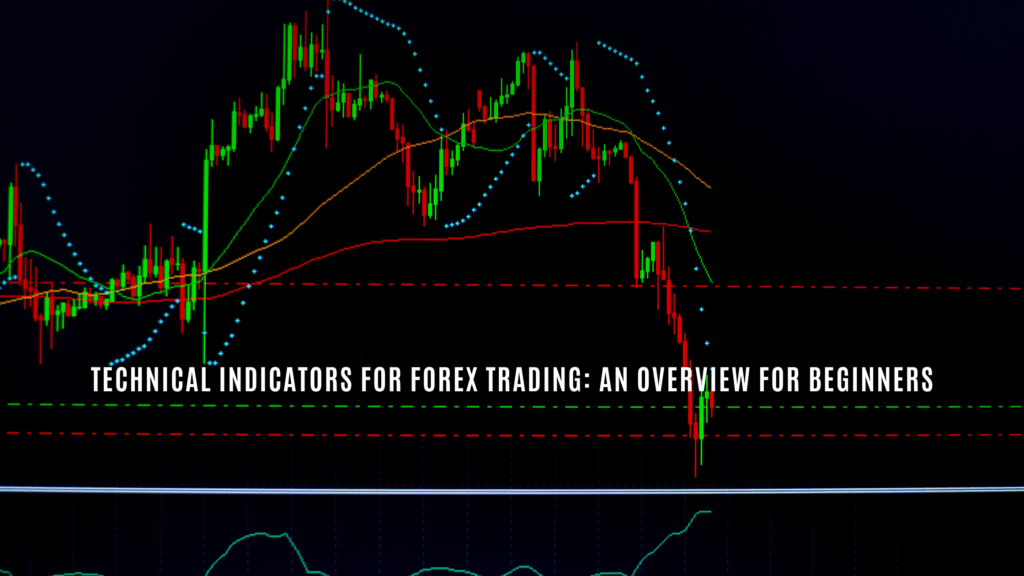
Traders use technical analysis as a popular trading method in the foreign exchange (forex) market to analyze market trends and try to predict future price movements. Technical indicators serve as essential trading tools in technical analysis, which are mathematical calculations based on the price and/or volume of a currency.
An Overview of Technical Indicators for Forex Trading
In this article, we will take a closer look at some of the most commonly used technical indicators in the forex market and how traders may use them to analyze market trends and make trades.
Moving Averages
Traders consider moving averages as one of the most commonly used technical indicators in the forex market. A moving average uses mathematical calculations to derive the average price of a currency over a certain period and plots it on a chart.
The simple moving average (SMA) and the exponential moving average (EMA) are common moving averages used by traders in the forex market. For example, if a trader plots a 50-day moving average and a 200-day moving average on a currency pair chart, they can see how the short-term trend of the currency pair relates to the long-term trend.
Relative Strength Index (RSI)
As a momentum oscillator, the RSI compares the impact of recent gains to recent losses to determine the overbought and oversold conditions of an asset. The RSI oscillates between 0 and 100, with readings above 70 indicating that a currency is overbought and below 30 indicating that a currency is oversold.
For example, if the RSI of a currency pair is above 70, a trader may consider selling the currency, as it is likely to experience a price decrease.
Bollinger Bands
As a volatility indicator, Bollinger Bands plot a simple moving average with two standard deviation lines above and below. These bands are used to identify possible breakouts or trend reversals.
For example, if the price of a currency appears near the upper Bollinger Band, traders may consider the market conditions overbought and may consider selling the currency. Conversely, if the price of currency seems near the lower Bollinger Band, traders may consider market conditions oversold and may consider buying the currency.
Stochastic Oscillator
Stochastic Oscillator compares the closing price of a currency to its price range over a specific period. It consists of two lines, %K and %D. The %K line is the most sensitive and represents the currency’s current closing price in relation to its highest and lowest prices over the chosen period.
The %D line is a moving average of the %K line. Traders often use the %K and %D lines to identify potential trend reversals. For example, if the %K line crosses above the %D line, it could indicate that the currency is trending upwards, and traders might consider buying. Conversely, if the %K line crosses below the %D line, it could indicate that the currency is trending downwards, and traders might consider selling.
Conclusion
Technical indicators can serve as practical tools that traders in the forex market can use to analyze market trends and make predictions about future price movements. Some of the most commonly used technical indicators include Moving Averages, Relative Strength Index, Bollinger Bands, and the Stochastic Oscillator.
These indicators can be used in various ways to identify overbought and oversold conditions, detect possible trend reversals, and identify the overall direction of the market.
However, it is essential to note that while technical indicators can provide valuable information, traders should use them in conjunction with other forms of analysis, such as fundamental analysis, and traders should always have a proper risk management strategy.
It is always essential to research and seek professional financial advice before entering any trade.

