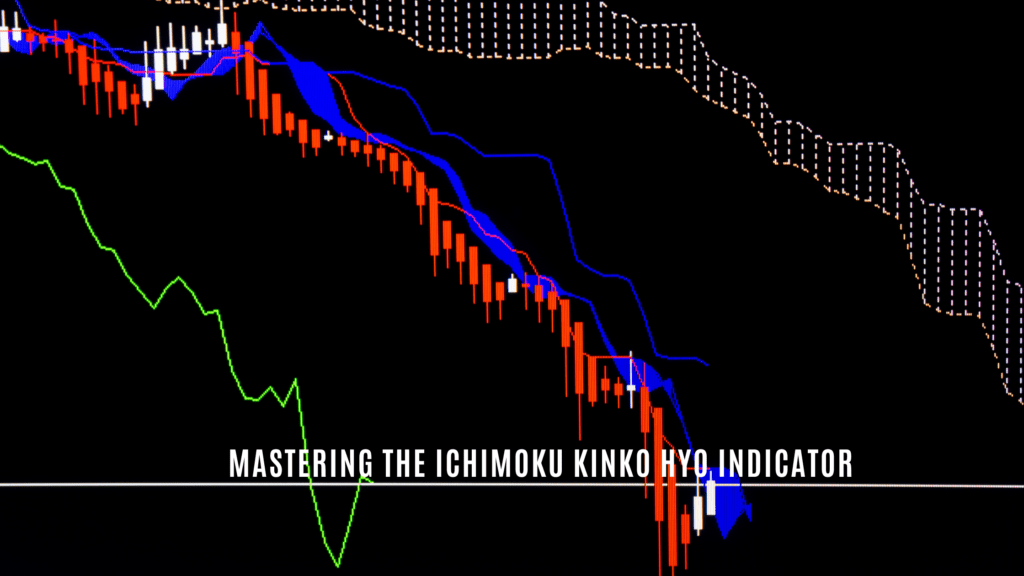
The Ichimoku Kinko Hyo indicator in forex, also known as the Ichimoku Cloud, is a technical analysis tool developed in Japan in the 1930s. The indicator consists of five lines plotted on a chart, including the Tenkan-sen, Kijun-sen, Senkou Span A, Senkou Span B, and Chikou Span. In this article, we will discuss using the Ichimoku Kinko Hyo indicator in Forex trading to identify profitable trading opportunities potentially.
Understanding the Indicator for Forex
The Ichimoku Kinko Hyo indicator uses a design that attempts to supply a comprehensive view of the market, including both the current trend and future market direction. The Tenkan-sen and Kijun-sen lines identify the current trend, while the Senkou Span A and Senkou Span B lines identify potential future market direction. The Chikou Span line is used as a confirmation tool to confirm the trend identified by the other lines.
Applying the Indicator to Forex Trading
One way to use the Ichimoku Kinko Hyo indicator in Forex and Cryptocurrency trading is to find the current trend and potential future market direction. For example, if the Tenkan-sen and Kijun-sen lines point upwards, this may indicate an uptrend, and traders may consider entering a long position. If the Senkou Span A and Senkou Span B lines also point upwards, this may indicate a strong uptrend, and traders may consider holding onto the position.
Another way to use the Ichimoku Kinko Hyo indicator in Forex trading is to use it in combination with other technical indicators and analysis to confirm potential entry and exit points. For example, a trader may use the Ichimoku Kinko Hyo indicator to confirm a possible entry point identified using Fibonacci retracement levels or a moving average crossover.
Forex Traders can also use the Ichimoku Kinko Hyo indicator to find potential support and resistance levels. For example, if the price is trading above the Cloud (formed by the Senkou Span A and Senkou Span B lines), it may be considered a bullish signal, and the Cloud may act as a support level. On the other hand, if the price is trading below the Cloud, it may be considered a bearish signal, and the Cloud may act as a resistance level.
It is important to note that using the Ichimoku Kinko Hyo indicator requires a certain level of skill and experience, as traders can encounter difficulty accurately interpreting the signals generated by the indicator. Additionally, the indicator is not always accurate, and market conditions may change, so traders should always use it in conjunction with other analysis and risk management strategies.
Conclusion
The Ichimoku Kinko Hyo indicator is a powerful tool for Forex traders, supplying a comprehensive view of the market and the potential for profitable trading opportunities. By understanding the underlying principles of the indicator and using it in conjunction with other forms of analysis and risk management strategies, traders can potentially make more informed trading decisions. Remember, past performance is not necessarily indicative of future results. It is essential to seek professional advice before making any investment decisions and to do your research and seek independent financial advice.