Traders use technical analysis as a popular method in the forex market to find trends, potential buying and selling opportunities, and key support and resistance levels. In this article, we will explore the basics of technical analysis and take a closer look at how to use specific charts to trade popular currency pairs such as EUR/USD and GBP/USD.
Technical Analysis to Forex Market
Before diving into the specifics of chart analysis, it is important to understand technical analysis. Technical analysis aims to use historical price and volume data to identify patterns that can indicate future market behavior. Traders use this information to make informed decisions about when to enter or exit a trade.
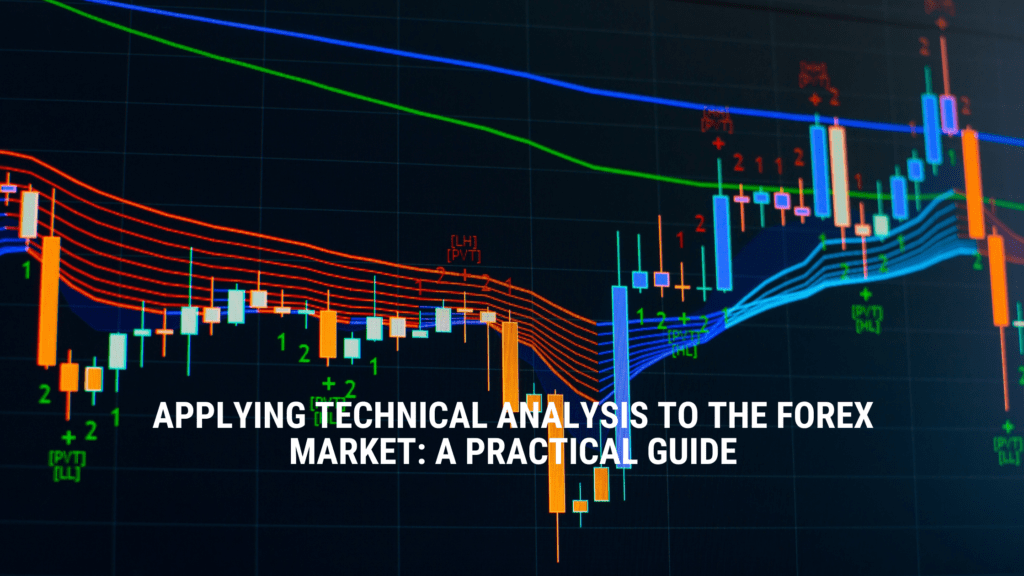
One of the most popular forms of technical analysis in the forex market involves using price action charts. Charts provide a visual representation of historical and current price action that traders can use to identify patterns and trends that can indicate buying or selling opportunities. In this section, we will take a closer look at how to use different types of charts to analyze popular currency pairs such as EUR/USD and GBP/USD.
EUR/USD: Using Line Charts for Trend Analysis
The EUR/USD currency pair represents one of the most widely traded and closely watched pairs in the forex market. Traders can use line charts to analyze the long-term trend of the pair, as well as to identify key levels of support and resistance. For example, a trader might observe that the EUR/USD in an uptrend for several months and use this information to decide to enter into a long position.
In another example, a trader might observe that a key level of support, such as a previous low price, getting breached and decide to enter into a short position.
GBP/USD: Using Candlestick Charts for Price Action Analysis
GBP/USD, also known as “cable” represents another popular currency pair. Candlestick charts can be used to analyze the short-term price action of the pair, as well as to identify patterns that can indicate a potential reversal in the trend. For example, a trader might observe a bearish engulfing pattern, where a large red candle completely engulfs a small green candle, and use this information to decide to enter into a short position.
Trading USD/JPY: Finding Reversals with Candlestick Charts
Traders consider candlestick charts as a resourceful form of charting used in technical analysis. These charts display the opening and closing prices and the high and low prices for a currency pair over a specific period.
For example, a trader might monitor the USD/JPY pair and observe a bearish candlestick pattern known as the “hanging man” on the chart. This pattern forms when the pair appears in an uptrend, and a bearish candle forms with a small real body, a long upper shadow, and little or no lower shadow. A trader might interpret this pattern as a potential top and sell the currency pair.
In conclusion,
Technical analysis can supply traders with powerful trading tools that they can use to identify trends and potential buying and selling opportunities in the forex market. By understanding and using specific charts to analyze popular currency pairs such as EUR/USD and GBP/USD, traders can make more informed decisions about when to enter or exit a trade.
It is important to remember that the examples provided here are hypothetical and used to illustrate the concept, not a trading recommendation. Traders should always conduct their own analysis, consider their risk tolerance, and consult a financial advisor before making a trade.