Candlestick patterns represent an integral part of forex price action analysis. Candlestick patterns can supply incredible information about the supply and demand for a trading instrument, showing forex traders high probability trading signals on forex price charts. Therefore, forex traders must diligently learn what to look for in candlestick patterns that can occur in the foreign exchange market.
In this article, we will discuss the engulfing candlestick formations, which some forex traders arguably consider one of the most popular and profitable price action strategies to keep in the trading playbook. We will examine the anatomy of this chart pattern and discuss a strategy for combining it with other forms of trading analysis.
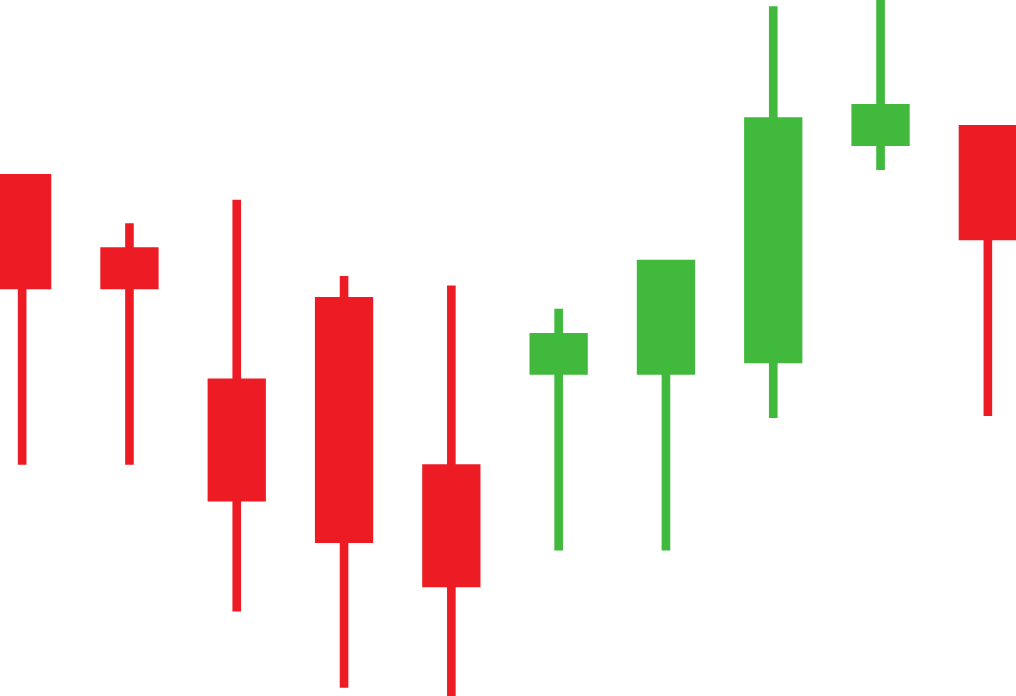
Forex Price Action Concepts: Trading Engulfing Patterns
You may not realize forex traders can use more than one engulfing pattern within a price action trading strategy. Specifically, forex traders can use bullish engulfing and bearish engulfing candles, both of which supply a mountain of price action information and data for those who know how to recognize the patterns correctly. As mentioned before, many currency traders consider the engulfing pattern arguably one of the most critical and highly effective price action concepts to use in the trading world.
Inside the Anatomy of the Engulfing Candlestick Pattern
Moving on, we have discerned the existence of two engulfing patterns, the bullish engulfing pattern, and the bearish engulfing pattern. This section will dissect the anatomy of the engulfing pattern and discuss the various things to look out for when trading engulfing candlestick patterns.
Forex Traders should consider the engulfing candlestick pattern as a two-candle reversal pattern because it takes two candlesticks of specific lengths to confirm the pattern. The first candle in this formation looks like any other candlestick you would pay attention to when trading currencies. However, the second candlestick completely towers over the first candle engulfing it without not caring about the length of the tails.
The engulfing pattern can appear in a downtrend or an uptrend and can also occur in ranging and choppy markets. Suppose we use daily charts as an example and use a bullish engulfing candle on the second day of the trading pattern. In that case, the currency price might open lower than the previous low. Yet, the bulls are beginning to take control which subsequently pushes the price up to a higher level than the previous high, resulting in an obvious win for the buyers.
However, some people might take a different stance and argue that you should enter at once after the close of the engulfing candle. We recommend waiting for the price action to move higher before buying into the position. In other words, after confirming the downtrend reversal.
A bullish engulfing pattern can occur when a small bearish candlestick following a bearish trend has a large bullish candlestick following it the next day. The candlestick body completely overlaps or engulfs the body of the candlestick that occurred the previous day. You might typically see bullish engulfing candlestick patterns either at the end or towards the end of a trend, signaling a possible reversal.
Now a bearish engulfing pattern can occur similarly, except you need to flip things around. So, when a small bullish candlestick appears, showing signs of a bullish trend has a large bearish engulfing candlestick following it the next day, which completely covers and engulfs the whole body of the candlestick that occurred the previous day. Likewise, with the bearish engulfing pattern, you will typically find these patterns at the end of a trend or towards the end of a trend and again can signal an imminent trend reversal.
The Psychology Found with Bearish Engulfing Patterns
Forex Traders should not interpret a bearish engulfing pattern as a bearish candlestick, standing for negative price movement, followed by a bullish candlestick, representing upward price movement. For a bearish engulfing pattern to form, the currency pair must open at a higher price on the second day than it closed on the first day. If the price did not gap up, the body of the red candlestick would not have had a chance to engulf the body of the candlestick formed the previous day. So, what does this tell us?
Chart 1

Well, let us break it down. Looking at the daily chart above (Red Circle-Chart 1), the first day shows a positive green candle that looks like any other bullish candle. Evaluating this scenario, we can assume that market bulls controlled price action on the first day. Now for the second day, we start with the candle in the green continuing to head north, but things take a turn, and the sellers are now starting to wake up and take control of the situation. Throughout the day, the bears push the bulls out of the picture, which they do successfully.
Since the currency pair opens higher than it closed on the previous day and closes lower than it opened on the previous day, the red candlestick shows a bearish engulfing pattern representing a day in which bulls controlled the price of the currency in the morning only to have bears take decisive action over by the end of the day.
Notice the essential characteristics of this price action! The bearish engulfing candle occurred at the end of a brief bullish trend, and you can see some partial slowdown with previous candles showing small bodies and long wicks. Not only that, but the engulfing red candle completely engulfs the last two candles. And this is on a daily chart, meaning what followed could have been a few hundred pips in movement.
The red candlestick of a bearish engulfing pattern typically has a small upper wick, if any. That means the currency closed at or near its highest price, suggesting that the day ended while the price still marched downward. Also, the missing upper wick increases the likelihood that the next day will produce another red candlestick that will close lower than the bearish engulfing pattern closed.
The Psychology Found with Bullish Engulfing Patterns
We can analyze the psychology of bullish engulfing patterns in the same manner as the bearish engulfing candles, except we need to think with a reverse mindset. So, in the example below (Red Circle-Chart 2), we can see that there has been a small downtrend where the bears have been in control for a while, with no signs of slowing down until the candles start to become smaller. Analyzing this price action tells us that the momentum of the trend is beginning to weaken and that we should stay alert for any possible reversals that might come soon.
Chart 2

Well, a reversal did happen, in the form of a bullish engulfing green candle. So, what can we derive from this in terms of market psychology? Well, something in the underlying market likely happened for the bulls to take control. What could have happened? Well, looking back through the fundamental data, which is publicly available, we can see the release of the Consumer Price Index figures during this time frame. The market obviously considered the news good; otherwise, the bullish run would not have continued for the next several days.
Trading Engulfing Patterns with Other Indicators
Like any other indicator, it is best to trade with confluence when more than one technical indicator and even fundamental factors line up. It is well-known that matching and pairing indicators can significantly improve the chances of completing a successful trade. Below, we will outline engulfing patterns traded in conjunction with other indicators, such as Support & Resistance or Fibonacci Retracements.
Chart 3

In Chart 3 above, you can see a bullish engulfing pattern paired with Bollinger Bands; an indicator considered a part of the top favorites of forex traders. You can see that the bullish engulfing green candle wholly engulfed the previous ten candles. Also, the contraction of the Bollinger bands, before the engulfing candle and then split, shows increasing buying pressure. This creates a confluence that forex traders love to see when pairing multiple indicators together, as it adds weight to the trading strategy.
Looking at Chart 4 below, we have an effective yet unappreciated trading indicator, the Ichimoku Cloud, a Japanese-based technical indicator. The Ichimoku Cloud combines multiple indicators, including support and resistance, into an immensely powerful indicator. It is easy to understand once you get your head around it, but when you are above the ‘cloud,’ you want to consider buying, and when you are below the ‘cloud,’ you want to sell. The indicator contains extra lines showing support and resistance.
As you can see in Chart 4, a bullish engulfing candle formed, smashing through the cloud, as well as resistance which is a clear sign that the bulls developed a posture for taking over the market, which ended up happening for a while.
Chart 4

Trading Engulfing Candles in Ranging Markets
From a practical perspective, trading engulfing candles in ranging markets does not make tremendous sense as it is better to wait for trends. Engulfing patterns seem to work best in trending markets. However, consider the following thoughts to trade engulfing patterns in ranging markets. First, it is critical to figure out the price floor and ceiling since they will function as the range boundary for price action to jump back and forth.
Second, it is best to wait for an engulfing candle to present itself near support or resistance instead of the middle of the range. When it comes to trading in range markets, the more comprehensive the range, the better chances increase for securing more pips or ticks.
Mistakes To Avoid When Trading Engulfing Patterns
Of course, many forex traders to have never traded engulfing patterns will want to dive right in, but it is crucial to take a breather and consider the common mistakes made by novice engulfing forex traders.
● Mistake #1: Placing stop losses too close to the engulfing candle: The trade needs adequate room to breathe and work. You do not want to trigger a stop too early, only for the trade to end up working. Keep a hold on your emotions and trust your strategy.
● Mistake #2: Not ensuring proper placement of an engulfing pattern on the chart before entering the trade. New forex traders might not recognize a currency trend or when that trend has ended. It is essential to recognize the signs of trends and range-bound markets, so you do not enter a trade at the wrong time. For example, you could enter what looks like a bearish engulfing candle trade in the middle of a bull run. When in reality, the market momentarily pauses due to profit-taking.
● Mistake #3: Trading candles that look like an engulfing pattern but, in actual fact, do not bear any of the characteristics costing forex traders money simply because they misunderstood the concept. In this case, it is essential to practice finding engulfing patterns by examining price action on historical charts. Such studying will help to permanently etch the concept in your memory and help you avoid false and fake engulfing candles