Technical Trading: Inside Bar Strategy
However, there are times when traders will see an inside bar referred to as an “IB”, and the mother bar referred to as an “MB”. It is important to note that traders will use these terms loosely and may take a more lenient approach with the definitions of an inside bar.
For example, some traders believe the highs of both the mother bar and inside bar can appear equal. Likewise, with the lows, these traders will likely think that the lows of both bars can appear similar too. Ok, we have briefly gone through the concepts of what defines an inside bar and how this particular Japanese candlestick set-up should appear. Let us now move on to the practical details on how trading inside bars can potentially help you make money.
Drilling down to the underlying basics of inside bars, this particular Japanese candlestick set-up illustrates to traders that there is a period of consolidation in the market. In other words, market consolidation refers to security prices that oscillate within a particular area and is generally known as market indecisiveness. In the trading world, traders mention this concept when discussing technical analysis. It describes the movement of currency prices within a pretty well-defined pattern of trading levels or pivots.
For example, traders could look at a daily chart scaling it down to lower time scales such as the one-hour and thirty-minute time frames and notice an inside bar will look like a triangle. They can often form after a period of strong movement in the market. For instance, if a central bank releases monetary policy that shifts interest rate predictions higher, the market may consider that information bullish, sending its currency pair higher.
Then after the market moves on news, a period of consolidation could occur, signaling a time when traders and big institutions are likely to take profits off the table, thus supplying an environment where an inside bar could likely generate. Furthermore, inside bar candlestick patterns also show themselves during times of potential market turning points and function as possible reversal signals from critical trading areas such as support and resistance levels.
Anatomy of Inside Bars
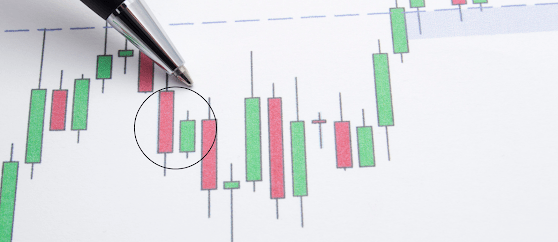
Now that we briefly touched upon the anatomy of inside bars let us move on to where you can expect to find these candlestick patterns. As mentioned briefly earlier, an inside bar is a particular pattern that involves two candles that traders can spot these candles on a variety of trading charts. The two candles consist of one larger candle, either a bearish selling candle or a bullish buying candle, and then the candle after that is known as the inside candle. Again, the name inside bar derives from the fact that the entire length of the candle falls within the preceding candle encapsulating it.
Even though some traders think that an inside bar can actually equal the same size as the preceding candle, or the “mother bar”, this idea seems problematic because a lot more inside bars would occur in all the wrong places on a trading chart. Understanding where these formations arise is crucial for price action and candlestick trading. If you see what looks like an inside bar formation, but it is in the wrong place, you risk losing money if you try to trade it. So, it is usually best to wait for inside bars that are smaller than the mother bars.
However, it is crucial to understand that inside bar formation works best when formed in a favorable place on trading charts. Therefore, being vigilant when looking for inside bar formations matters because they are pretty useless on their own, unlike when seen in the middle of a strong bull or bear run.
Psychology Behind Inside Bar Formations
Behind all Japanese candlestick formations lies a certain level of psychology. Specifically, the psychology of price action really focuses on the crowd mentality amongst traders. As previously mentioned, inside bar formations are usually the result of market consolidation. In certain aspects, this can lead to good opportunities, such as the chance to execute a trade with a favorable risk to reward ratio. When you think about it, inside bar formations function as leading indicators within the market on what could likely happen next.
Example Trades Using Inside Bar Formations
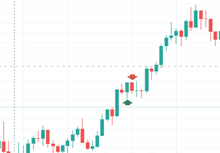
Now, let us review some trade examples where the inside bar formation occurred and how they play out. Looking at the trading example below, we are trading with the bullish trend on a weekly chart. During the bull, run consolidation started to occur, and traders likely took profits off the table. Shortly after that, an inside bar (red arrow) generated, followed by a continuation of the bullish run.
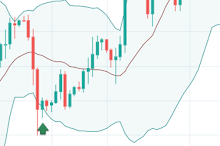
Looking at the chart below, you can clearly see a well-defined inside bar (green arrow) in relation to its absolutely towering mother bar. To further illustrate ways to enhance the inside bar trading strategy, we added the popular technical indicator, Bollinger Bands.
As you can see, the inside bar formed in what traders typically consider the statistically oversold region on the Bollinger Bands. However, you can see that we have a confluence where two or more technical indicators align. On the one hand, we have a bullish inside bar, and on the other hand, we have the Bollinger bands signaling that price has entered an oversold area and an area of support. Therefore, giving traders a more robust level of confidence that the financial instrument is likely to move higher using a favorable risk to reward trade set-up.
Trading Inside Bars in Ranging Markets
Ranging markets usually attract traders who can clearly see the playing field and implement effective trading strategies. However, some traders happily avoid range-bound trading until the market resumes one direction. For traders who like trading ranging markets, this section will briefly detail how to leverage inside bars within the pricing range.
In financial markets, traders define the range as the difference between the low and high prices for a security or index over a specific period. Traders will typically use technical analysis to pinpoint entry and exit points for trades.
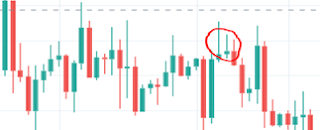
When it comes to trading inside bars within a range, you must make sure that price action is actually ranging. So, look for areas where the price action has roughly rebounded the same areas a few times. As you can see in the image below, that price has approximately risen and fallen around the same place.
Regarding trading a range using inside bars, look at the red circle where an inside bar has formed near the top of the range and is now an area of resistance. A trader could view the inside bar as a bearish opportunity since it formed at the top of the range and notice how the price sold off towards the bottom. This example shows another possibility for traders to effectively use inside bars, even for short-term gains.
Mistakes To Avoid When Trading Inside Bars
Trading is inherently risky, which requires traders to overcome greed and fear to learn how to minimize any potential losses due to emotional trading.
Trading with inside bars requires understanding the mistakes that could occur. Traders make a common mistake by trading inside bars as a singular entity. Instead, traders should focus on confluence trading. Specifically, traders should try to use more than one indicator to confirm the directional bias. For example, a trader sees an inside bar displayed on a chart and decides to add support and resistance zones to verify their trade.
Another familiar mistake traders make involves placing trades in the wrong place. What is meant by the wrong place? Well, trading is not only about trading set-ups using technical indicators or price action but also about analyzing the psychology of the market. For example, a trader decides to short the oil market during a massive bull run because a bearish engulfing candle forms. In other words, seeing an inside trading bar form is not enough to go against a trend on its own. Traders who venture down this road risk having their accounts implode.
An additional mistake traders make involves not trading the inside bar pattern on the daily chart. An inside bar on the daily chart shows a period of consolidation on the lower time frames, but it also displays potential breakouts from the consolidation. The daily chart holds significant weight when it comes to inside bars because it acts as a smoother over sideways movement that could occur on lower time frames.
Using higher time frames in conjunction with the daily chart eliminates a lot of confusion, over-analysis, and second-guessing, leading to over-trading on the lower time frames. It is important to remember that sideways or choppy markets are noisy, making them the hardest to trade.
Conclusion
We have learned a great deal about inside bar trading, from how to find them to using multiple indicators with them and ways to avoid common mistakes. All information contained within this article should help to function as a beginner guide to gaining proficiency in trading inside bars. As mentioned earlier, trading is not without risk, and before diving into a live account using the inside bar strategy, assessing it in a demo account is essential. Otherwise, there is a risk for serious account disaster, which could lead to becoming a member of the 90/90/90 club, where 90% of traders lose 90% of their money within 90 days.